Analysis of a client’s legacy production system revealed expensive, memory intensive large fetch queries that were struggling to scale with increasing demand. This severely impacted JVM availability, and in some cases provided consumers with incomplete data.
With replacement systems some way off effort was focussed on stabilisation and increasing the life of the existing system. Tests were carried out to investigate and find out how much time was available before performance deteriorated further. Results showed significant memory pressure and excessive GC activity, and a plan outlining options to manage, fix and tune created.
The client’s microservices architecture used in memory java data structures built using Netflix technology for fast API query performance, change detection, and large complex full data retrieval (a multi-class workload comprising realtime user, realtime system and batch type processing).
Scaling vertically was not desirable due to potential impact on GC latency (a GC review was carried out separately). Additional nodes were deployed as a tactic to manage but further work was required to understand options to fix the root of the problem.
Heap dumps were taken from production for offline analysis and tests conducted in a non-production environment to understand what was happening internally when large fetch requests were issued.
Analysis identified a very high object count for particular classes when large fetches were executed. Further reviews with the team revealed that the high object count was related to the creation of response payloads with a limited number of combinations, leading to a lot of object duplication. A proposal was made to change the application code to use a multiton pattern to create each combination once and reference. Tests to evaluate this showed it to be very effective in reducing String and BigDecimal object counts in the retained heap. The table below shows results of the first change made (c1 = change 1 below).
| Configuration | Objects | Shallow Heap (Bytes) | Retained Heap (Bytes) |
|---|---|---|---|
| Baseline | 8,371,473 | 200,915,352 | 663,629,496 |
| c1 | 99 | 2,376 | 6,632 |
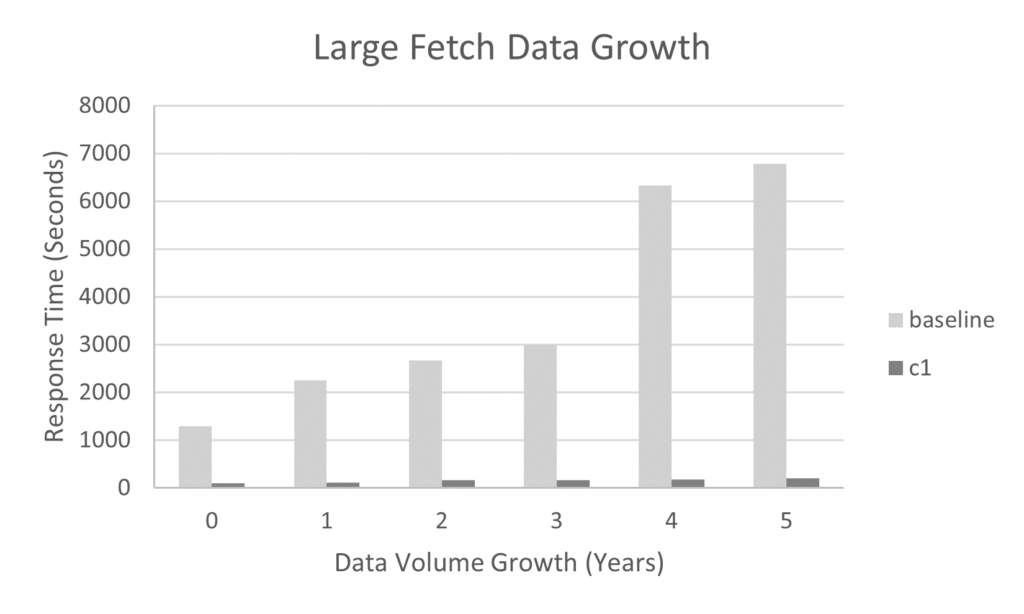
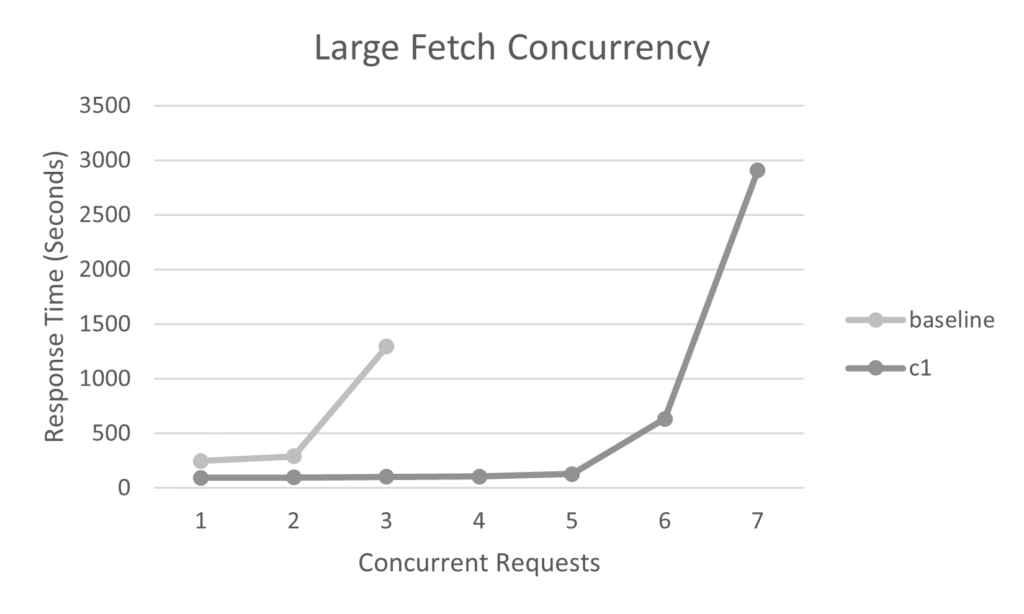
Further candidates were identified and three more changes made, reducing JVM heap usage by 50%. The charts below show the impact on request concurrency, request processing time and data volume growth for a single JVM.
This had multiple benefits for the client system:
- Extending data capacity from 18 months to 5 years
- Increasing large fetch concurrency per JVM from 2 to 5
- Reducing large fetch processing time from 240s to 100s
- No changes to payloads or interface specifications
Tips for anyone embarking on this type of exercise would be to automate as much of the testing and resource capture as possible, and keep it well organised and structured – if a lot of tests are run it’s easy to get lost in the results. Make sure the test data is the right shape and size, and make sure any changes are fully soak tested and functionally regression tested. The Eclipse Memory Analyser has good features for searching and exploring a heap e.g. inbound and outbound references, and it is faster than some other options tried. GDB is a good option for minimising pause time when taking heap dumps, java flight recorder is a good option for detailed JVM internals and TLAB information, and VisualVM for runtime monitoring and heap dumps.